Plot common support based on the standard deviation rule, chi squared rule, or both
Source:R/plot_common_support.R
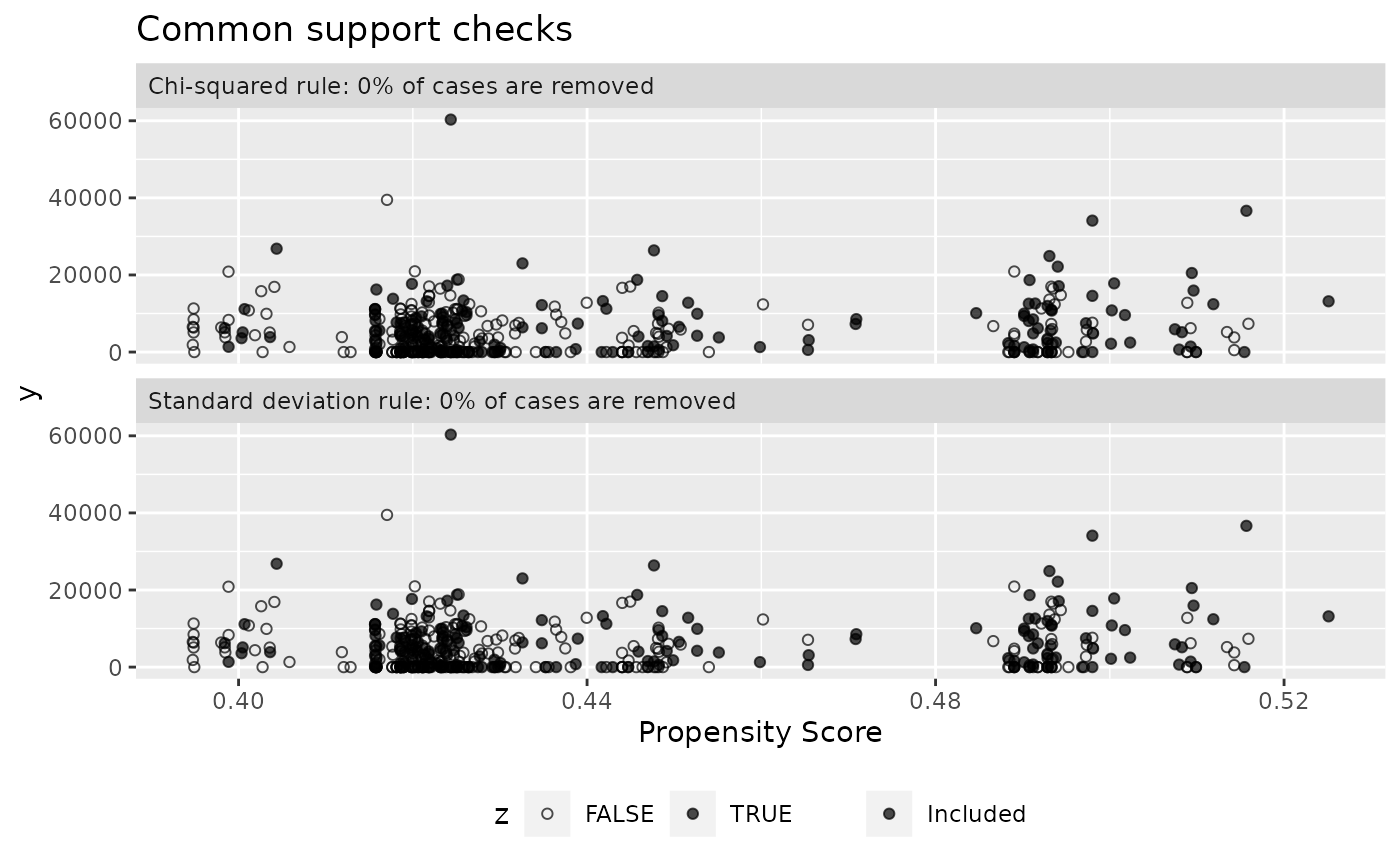
plot_common_support.RdPlot common support based on the standard deviation rule, chi squared rule, or both.
Usage
plot_common_support(
  .model,
  .x = NULL,
  .y = NULL,
  rule = c("both", "sd", "chi")
)
Arguments
- .model
a model produced by `bartCause::bartc()`
- .x
a character string denoting which covariate to use a the x axis default is to use a regression tree to predict the variable with least common support.
- .y
a character string denoting which covariate to use a the y axis default is the outcome variable y
- rule
one of c('both', 'sd', 'chi') denoting which rule to use to identify lack of support
Details
Sufficient overlap/common support is an assumption of causal inference. BART models use the uncertainty of counter factual uncertainty. When the posterior distribution of an individual's counterfactual prediction extends beyond a specified cut-point, that point likely has insufficient common support. 'bartCause' model offer the option to automatically remove points without common support from analyses, however, this must be specified during model fitting. Cut-points are determined through one of two rules: the standard deviation (sd) or chi-squared (chi). Under the standard deviation rule, a point has weak common support if its posterior distribution of the counterfactual deviation is greater than the maximum posterior of the observed predictions with 1 standard deviation of the distribution of standard deviations for each individual's predicted outcome under the observed assignment. Under the chi-squared rule, a point is discarded if the variance between its counterfactual prediction over observed prediction are statistically different under a chi-squared distribution with 1 degree of freedom. For more details on discard rules see Hill and Su 2013.
When called this plot will show how many points would have been removed under the standard deviation and chi-squared rules. This plot should be used as a diagnostic for 'bartCause' models fit without a common-support rule.
References
Hill, J., & Su, Y. S. (2013). Assessing lack of common support in causal inference using Bayesian nonparametrics: Implications for evaluating the effect of breastfeeding on children's cognitive outcomes. The Annals of Applied Statistics, 1386-1420.
Examples
# \donttest{
data(lalonde)
confounders <- c('age', 'educ', 'black', 'hisp', 'married', 'nodegr')
model_results <- bartCause::bartc(
 response = lalonde[['re78']],
 treatment = lalonde[['treat']],
 confounders = as.matrix(lalonde[, confounders]),
 estimand = 'ate',
 commonSuprule = 'none'
)
#> fitting treatment model via method 'bart'
#> fitting response model via method 'bart'
plot_common_support(model_results)

plot_common_support(model_results)

# }
# }