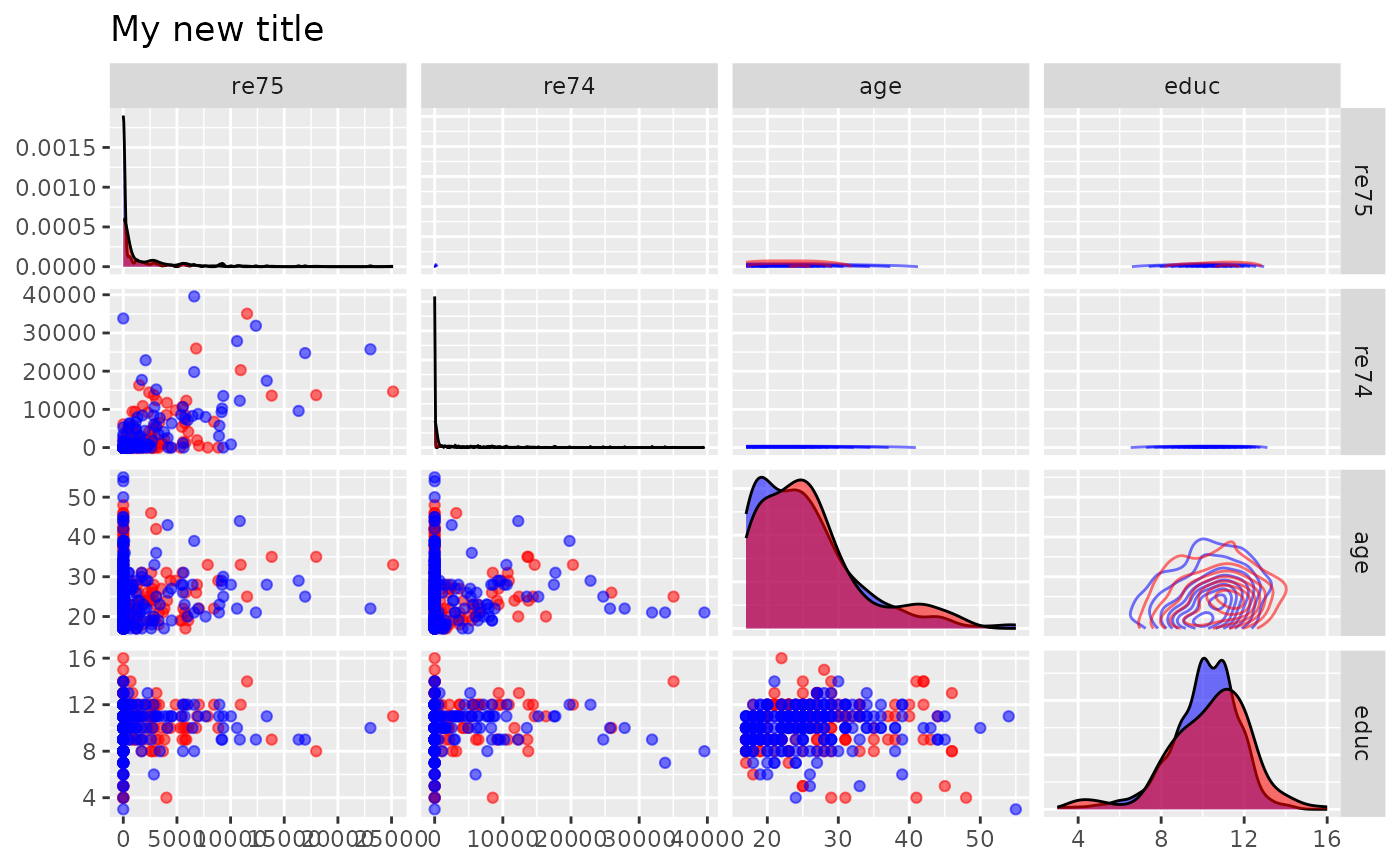
Visualize balance of the covariance of variables between treatment and control groups. Balance plot reflects balance in standardized units.
Arguments
- .data
dataframe
- treatment
the column denoted treatment. Must be binary.
- confounders
character list of column names denoting the X columns of interest
Examples
data(lalonde)
plot_covariance(lalonde, 'treat', c('re75','re74' , 'age', 'educ')) + labs(title = 'My new title')
#> Registered S3 method overwritten by 'GGally':
#>   method from
#>   +.gg   ggplot2
#> Warning: `stat_contour()`: Zero contours were generated
#> Warning: no non-missing arguments to min; returning Inf
#> Warning: no non-missing arguments to max; returning -Inf
#> Warning: `stat_contour()`: Zero contours were generated
#> Warning: no non-missing arguments to min; returning Inf
#> Warning: no non-missing arguments to max; returning -Inf
#> Warning: `stat_contour()`: Zero contours were generated
#> Warning: no non-missing arguments to min; returning Inf
#> Warning: no non-missing arguments to max; returning -Inf