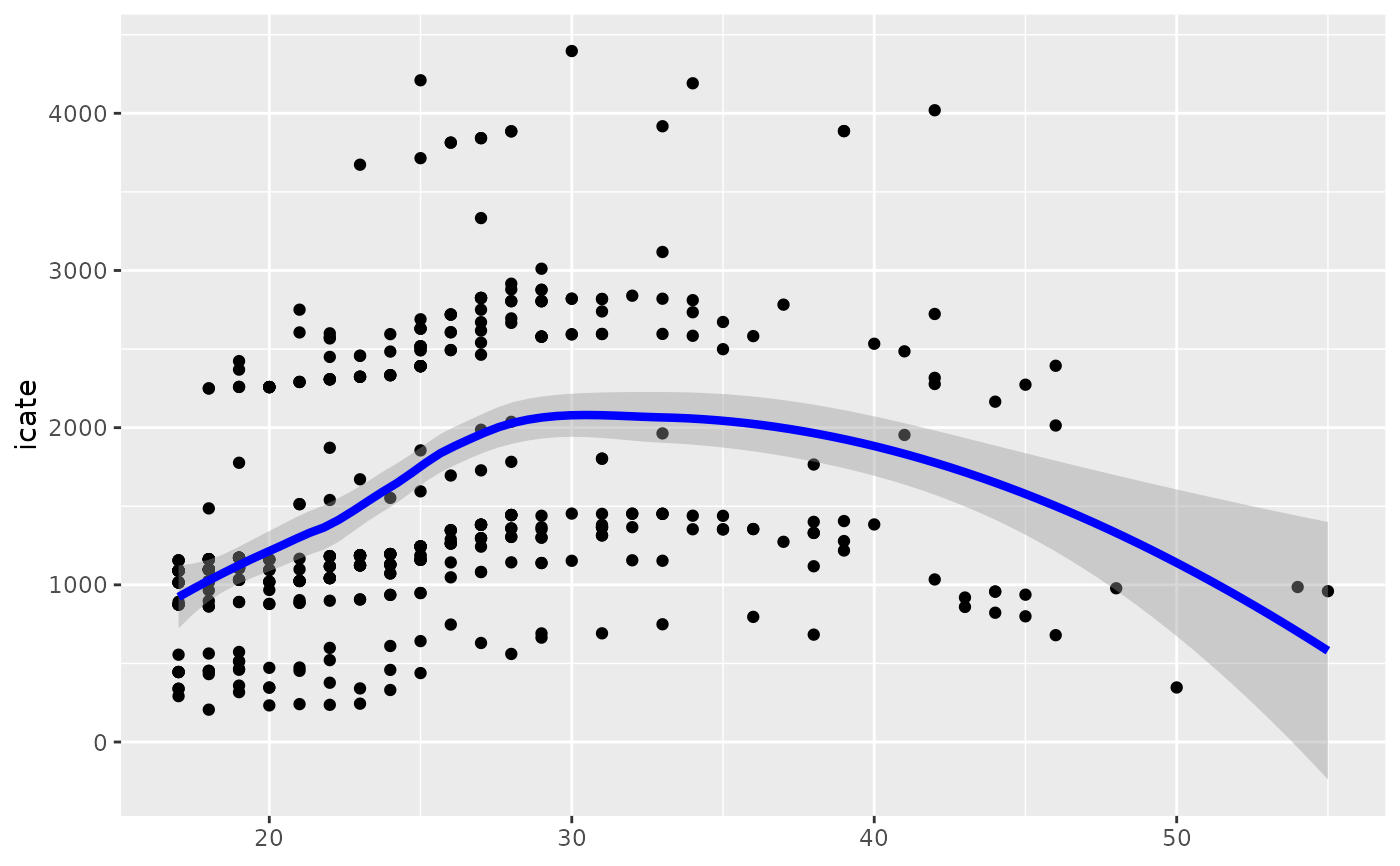
LOESS plot of a continuous moderating variable
Source:R/plot_moderators.R
plot_moderator_c_loess.RdPlot the LOESS prediction of ICATEs by a continuous covariate. This is an alternative to partial dependency plots to assess treatment effect heterogeneity by a continuous covariate. See Carnegie, Dorie and Hill 2019.
Arguments
- .model
a model produced by `bartCause::bartc()`
- moderator
the moderator as a vector
- line_color
the color of the loess line
References
Carnegie, N., Dorie, V., & Hill, J. L. (2019). Examining treatment effect heterogeneity using BART. Observational Studies, 5(2), 52-70.
Examples
# \donttest{
data(lalonde)
confounders <- c('age', 'educ', 'black', 'hisp', 'married', 'nodegr')
model_results <- bartCause::bartc(
 response = lalonde[['re78']],
 treatment = lalonde[['treat']],
 confounders = as.matrix(lalonde[, confounders]),
 estimand = 'ate',
 commonSuprule = 'none'
)
#> fitting treatment model via method 'bart'
#> fitting response model via method 'bart'
plot_moderator_c_loess(model_results, lalonde$age)

# }
# }