Partial dependency plot of a continuous moderating variable
Source:R/plot_moderators.R
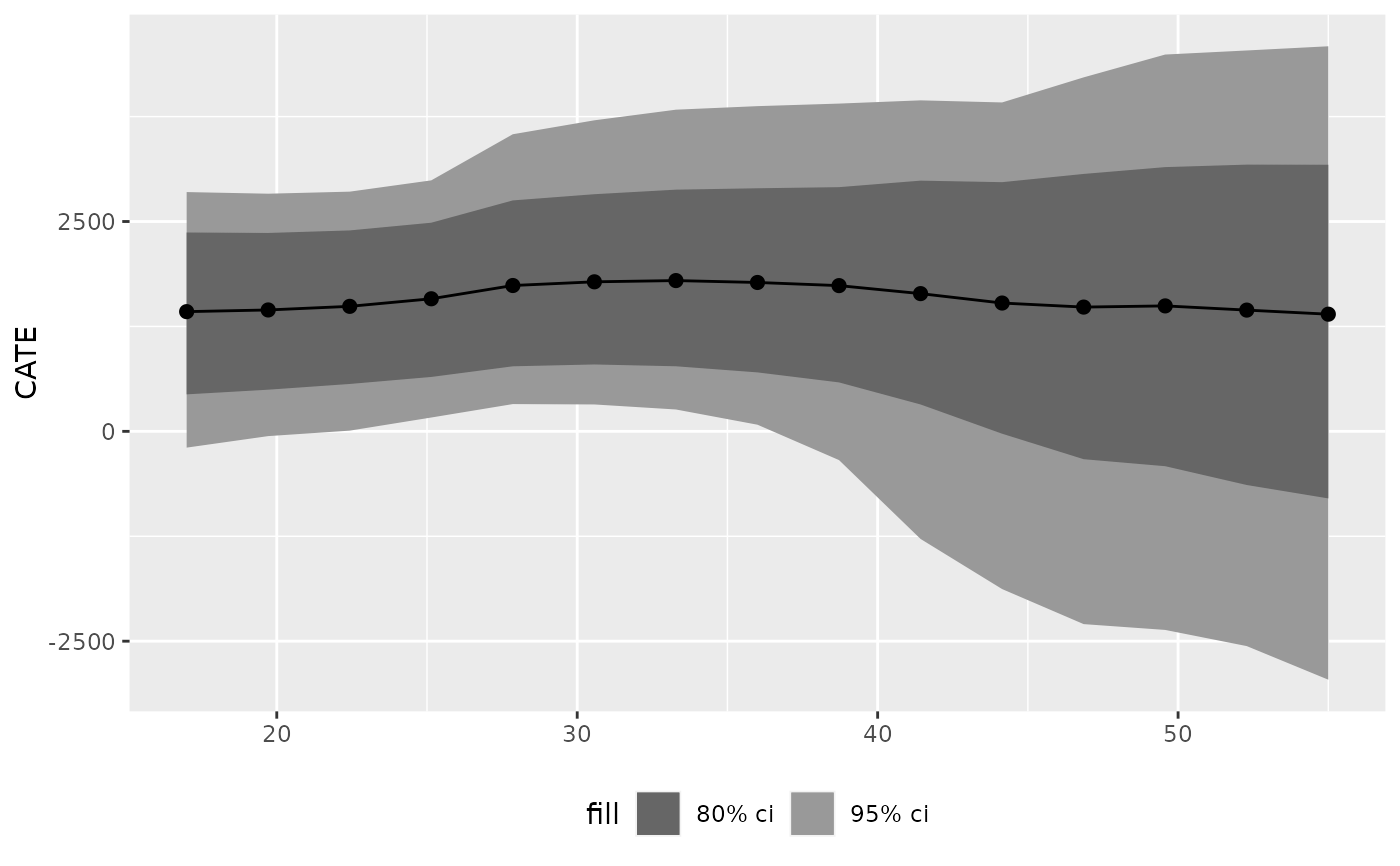
plot_moderator_c_pd.RdPlot a partial dependency plot with a continuous covariate from a 'bartCause' model. Identify treatment effect variation predicted across levels of a continuous variable.
Arguments
- .model
a model produced by `bartCause::bartc()`
- moderator
the moderator as a vector
- n_bins
number of bins to cut the moderator with. Defaults to the lesser of 15 and number of distinct levels of the moderator
Details
Partial dependency plots are one way to evaluate heterogeneous treatment effects that vary by values of a continuous covariate. For more information on partial dependency plots from BART causal inference models see Green and Kern 2012.
References
Green, D. P., & Kern, H. L. (2012). Modeling heterogeneous treatment effects in survey experiments with Bayesian additive regression trees. Public opinion quarterly, 76(3), 491-511.
Examples
# \donttest{
data(lalonde)
confounders <- c('age', 'educ', 'black', 'hisp', 'married', 'nodegr')
model_results <- bartCause::bartc(
 response = lalonde[['re78']],
 treatment = lalonde[['treat']],
 confounders = as.matrix(lalonde[, confounders]),
 estimand = 'ate',
 commonSuprule = 'none',
 keepTrees = TRUE
)
#> fitting treatment model via method 'bart'
#> fitting response model via method 'bart'
plot_moderator_c_pd(model_results, lalonde$age)

# }
# }