Plot the Conditional Average Treatment Effect conditional on a discrete moderator
Source:R/plot_moderators.R
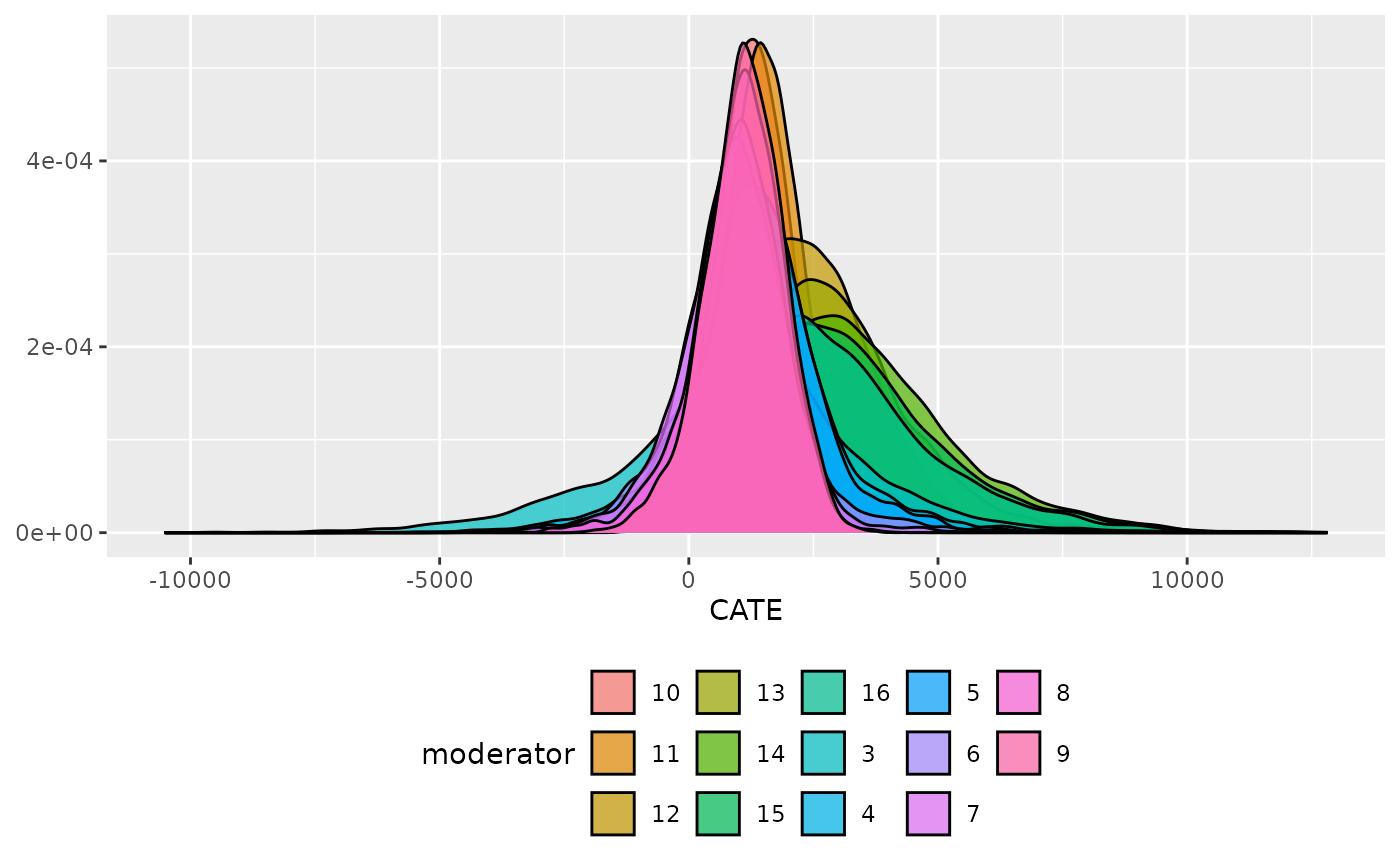
plot_moderator_d.RdPlot the Conditional Average Treatment Effect split by a discrete moderating variable. This plot will provide a visual test of moderation by discrete variables.
Usage
plot_moderator_d(
  .model,
  moderator,
  type = c("density", "histogram", "errorbar"),
  .alpha = 0.7,
  facet = FALSE,
  .ncol = 1
)
Arguments
- .model
a model produced by `bartCause::bartc()`
- moderator
the moderator as a vector
- type
string to specify if you would like to plot a histogram, density or error bar plot
- .alpha
transparency value [0, 1]
- facet
TRUE/FALSE. Create panel plots of each moderator level?
- .ncol
number of columns to use when faceting
Examples
# \donttest{
data(lalonde)
confounders <- c('age', 'educ', 'black', 'hisp', 'married', 'nodegr')
model_results <- bartCause::bartc(
 response = lalonde[['re78']],
 treatment = lalonde[['treat']],
 confounders = as.matrix(lalonde[, confounders]),
 estimand = 'ate',
 commonSuprule = 'none'
)
#> fitting treatment model via method 'bart'
#> fitting response model via method 'bart'
plot_moderator_d(model_results, lalonde$educ)

# }
# }