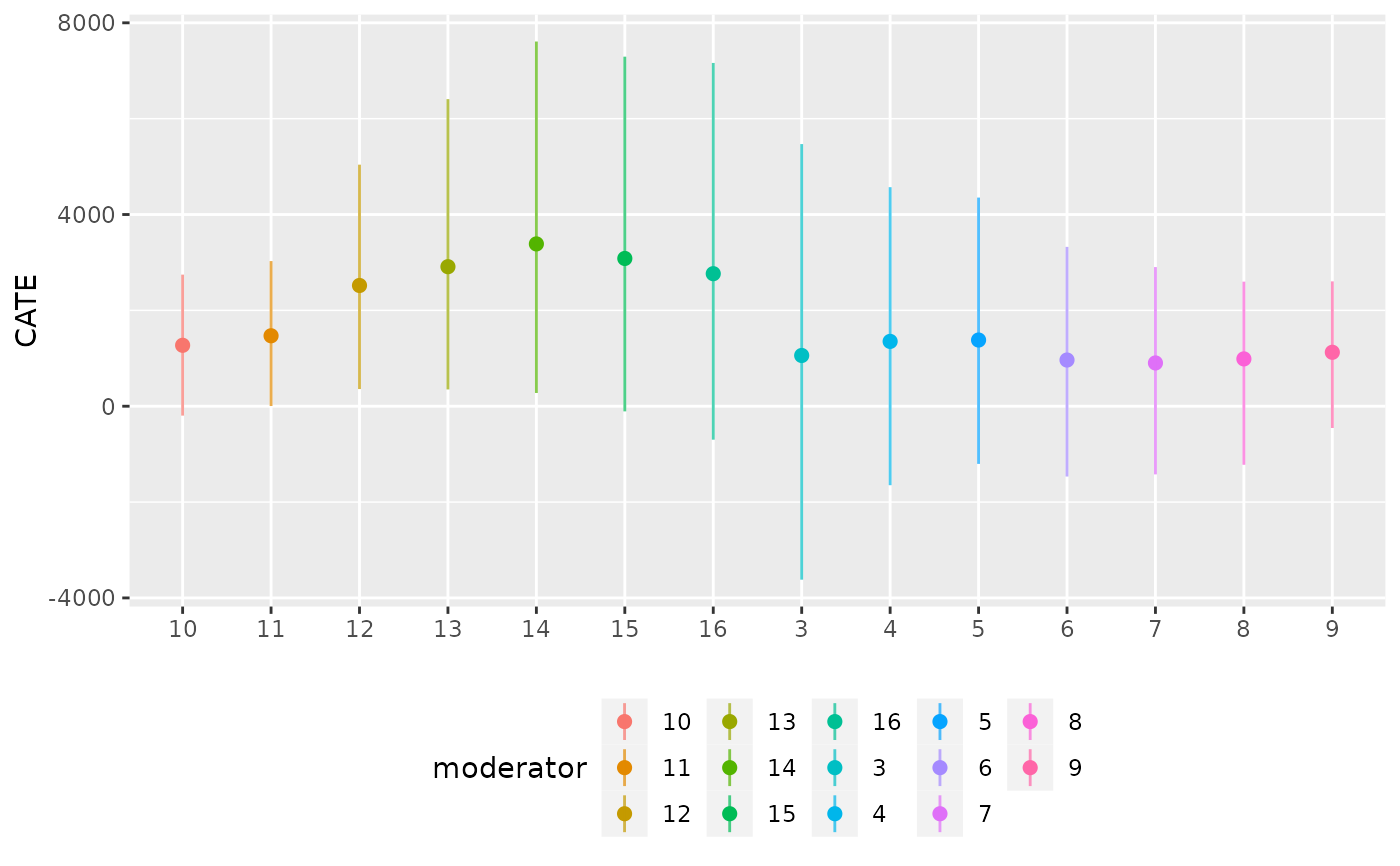
Plot the posterior interval of the Conditional Average Treatment Effect grouped by a discrete variable
Source:R/plot_moderators.R
plot_moderator_d_linerange.RdPlots the range of the Conditional Average Treatment Effect grouped by a discrete variable. This is analogous to plot_moderator_d_density but is preferable for moderators with many categories. Rather than plotting the full density, the posterior range is shown.
Arguments
- .model
a model produced by `bartCause::bartc()`
- moderator
the moderator as a vector
- .alpha
transparency value [0, 1]
- horizontal
flip the plot horizontal?
Examples
# \donttest{
data(lalonde)
confounders <- c('age', 'educ', 'black', 'hisp', 'married', 'nodegr')
model_results <- bartCause::bartc(
 response = lalonde[['re78']],
 treatment = lalonde[['treat']],
 confounders = as.matrix(lalonde[, confounders]),
 estimand = 'ate',
 commonSuprule = 'none'
)
#> fitting treatment model via method 'bart'
#> fitting response model via method 'bart'
plot_moderator_d_linerange(model_results, lalonde$educ)

# }
# }