Plot a single regression tree of covariates on ICATEs
Source:R/plot_moderators.R
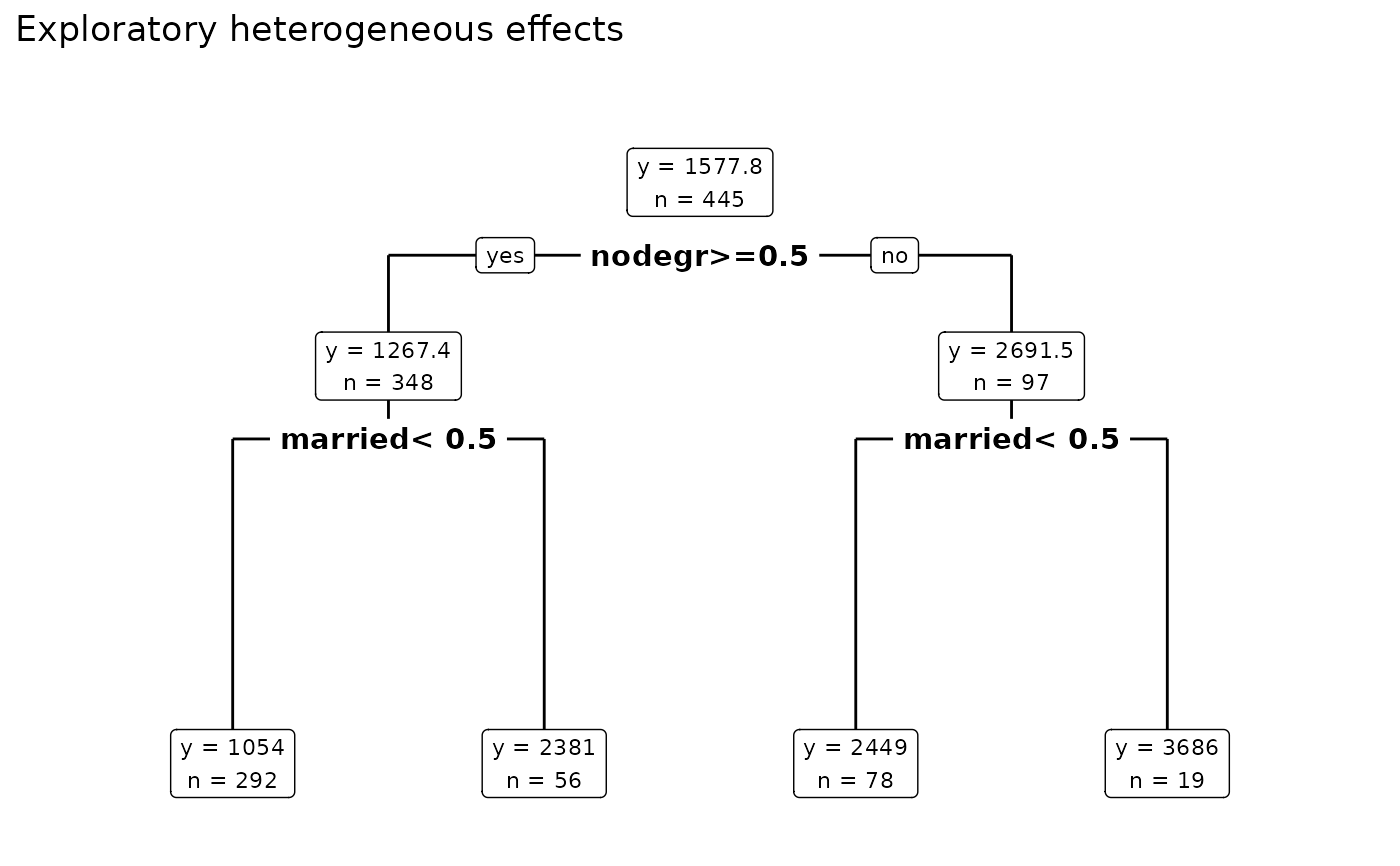
plot_moderator_search.RdPlot a single regression tree for exploratory heterogeneous effects. Fit single regression tree on bartc() ICATEs to produce variable importance plot. This plot is useful for identifying potential moderating variables. Tree depth may be set to depths 1, 2 or 3. Terminal nodes signal the Conditional Average Treatment effect within levels of moderation variables. Trees with different values across terminal nodes suggest strong treatment effect moderation.
Usage
plot_moderator_search(.model, max_depth = c(2, 1, 3))Arguments
- .model
a model produced by `bartCause::bartc()`
- max_depth
one of c(1, 2, 3). Maximum number of node levels within the tree. 2 is recommended
Examples
# \donttest{
data(lalonde)
confounders <- c('age', 'educ', 'black', 'hisp', 'married', 'nodegr')
model_results <- bartCause::bartc(
 response = lalonde[['re78']],
 treatment = lalonde[['treat']],
 confounders = as.matrix(lalonde[, confounders]),
 estimand = 'ate',
 commonSuprule = 'none'
)
#> fitting treatment model via method 'bart'
#> fitting response model via method 'bart'
plot_moderator_search(model_results)

# }
# }