Visualize balance of variables between treatment and control groups. Balance plot reflects balance in standardized units.
Examples
# \donttest{
data(lalonde)
confounders <- c('age', 'educ', 'black', 'hisp', 'married', 'nodegr')
model_results <- bartCause::bartc(
response = lalonde[['re78']],
treatment = lalonde[['treat']],
confounders = as.matrix(lalonde[, confounders]),
estimand = 'ate',
commonSup.rule = 'none'
)
#> fitting treatment model via method 'bart'
#> fitting response model via method 'bart'
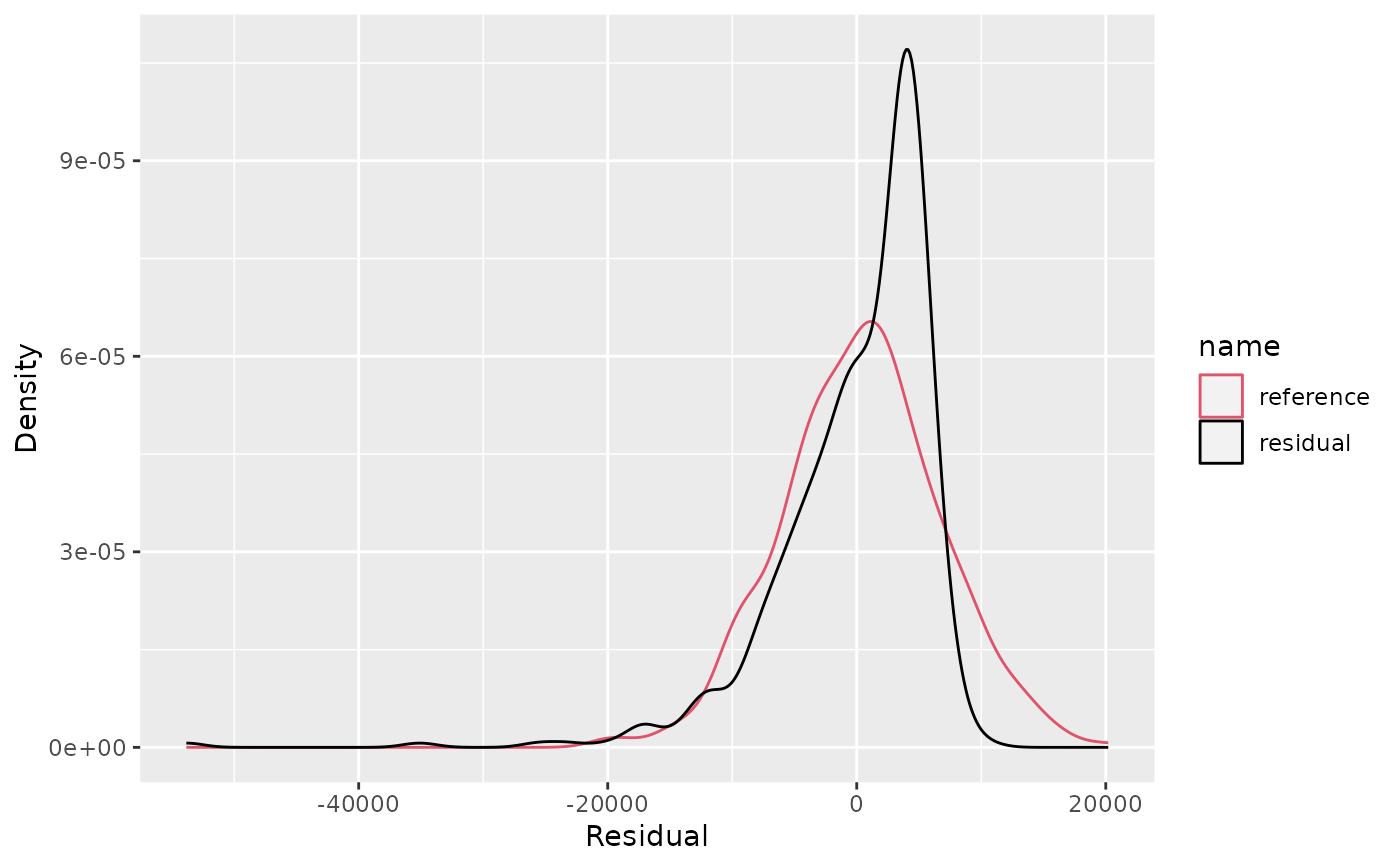
plot_residual_density(model_results)
 # }
# }