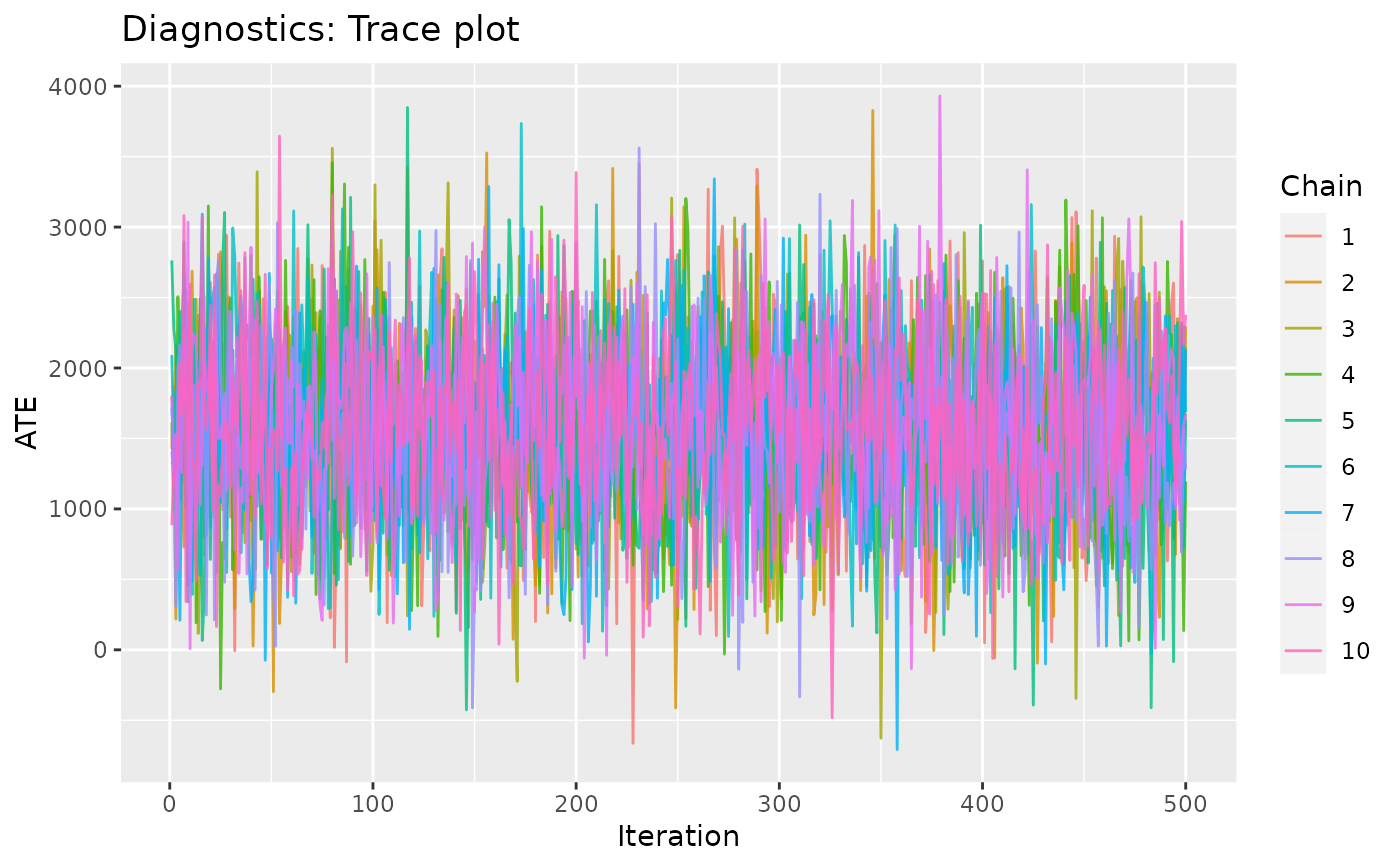
Returns a ggplot of the estimated effect over each iteration of the model fit. This is used to visually assess the convergence of Markov chain Monte Carlo (MCMC) sampling. Chains should be well mixed such that no single color is notably separate from others.
Usage
plot_trace(.model, type = c("cate", "sate", "pate", "sigma"))Arguments
- .model
a model produced by `bartCause::bartc()`
- type
parameter to plot options are average treatment effects: `cate`, `sate` and `pate` as well as posterior predicitve uncertainty `sigma`
Examples
# \donttest{
data(lalonde)
confounders <- c('age', 'educ', 'black', 'hisp', 'married', 'nodegr')
model_results <- bartCause::bartc(
 response = lalonde[['re78']],
 treatment = lalonde[['treat']],
 confounders = as.matrix(lalonde[, confounders]),
 estimand = 'ate',
 commonSup.rule = 'none'
)
#> fitting treatment model via method 'bart'
#> fitting response model via method 'bart'
plot_trace(.model = model_results)

# }
# }