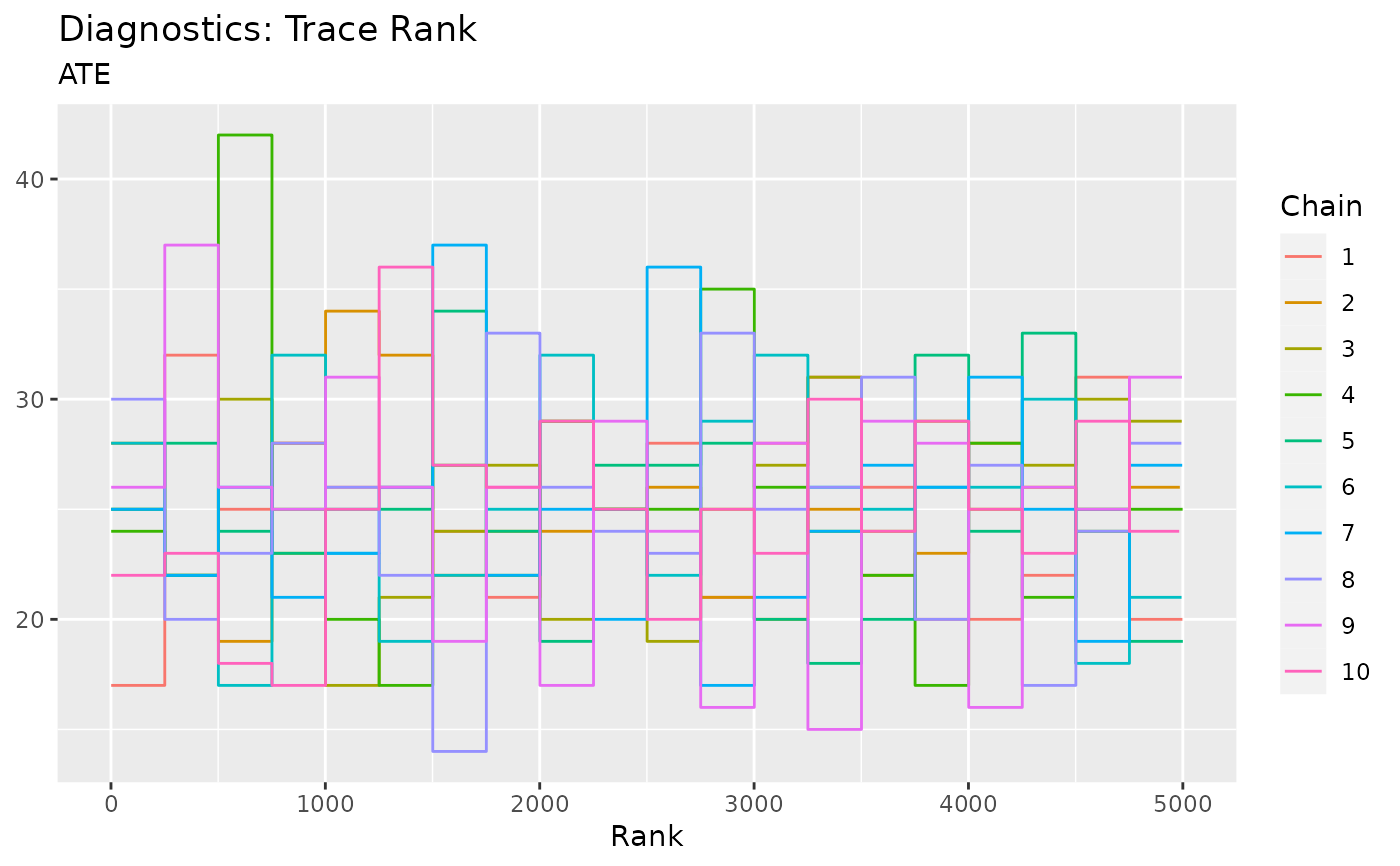
Trace plots may occlude convegence issues within Markov Chains. Trace rank plots present an alternartive convergence diagnostic of MCMC convergence. Trank plots are described in detail in Vehtari et al. (2021).
Usage
plot_trank(.model, type = c("cate", "sate", "pate", "sigma"))Arguments
- .model
a model produced by `bartCause::bartc()`
- type
parameter to plot options are average treatment effects: `cate`, `sate` and `pate` as well as posterior predicitve uncertainty `sigma`
References
Vehtari, A., Gelman, A., Simpson, D., Carpenter, B., & Bürkner, P. C. (2021). Rank-normalization, folding, and localization: An improved R ̂ for assessing convergence of MCMC (with discussion). Bayesian analysis, 16(2), 667-718.
Examples
# \donttest{
data(lalonde)
confounders <- c('age', 'educ', 'black', 'hisp', 'married', 'nodegr')
model_results <- bartCause::bartc(
 response = lalonde[['re78']],
 treatment = lalonde[['treat']],
 confounders = as.matrix(lalonde[, confounders]),
 estimand = 'ate',
 commonSup.rule = 'none'
)
#> fitting treatment model via method 'bart'
#> fitting response model via method 'bart'
plot_trank(.model = model_results)

# }
# }