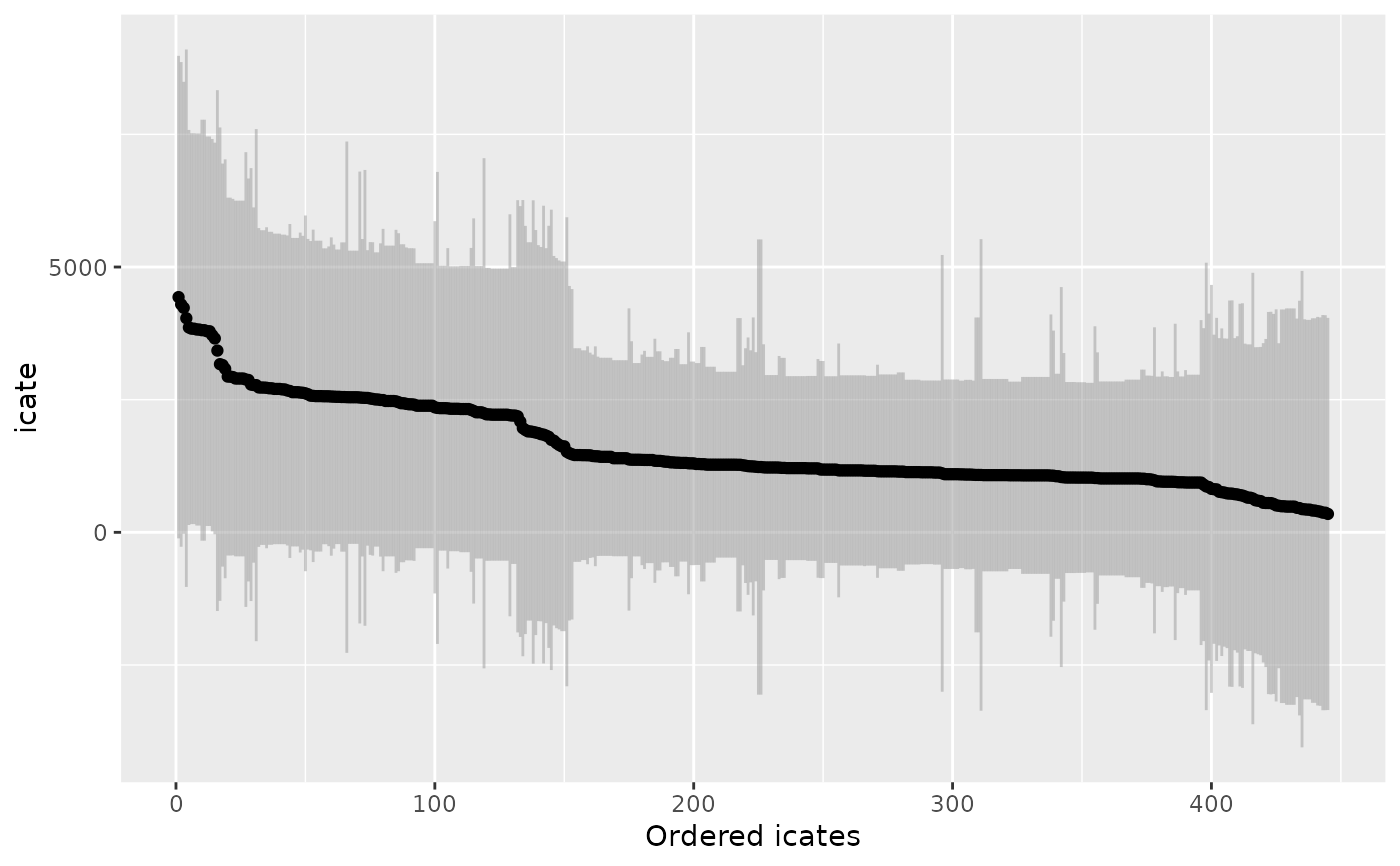
Plots the point and posterior intervals of each individual's ICATE ordered by the ICATE or a continuous variable. Points can be colored by a discrete variable. Waterfall plots are a useful visual diagnostic of possible treatment effect heterogeneity. A flat line implies little treatment effect heterogeneity while a steeper curve implies that the treatment effect varies across individuals in the sample. Ordering points by a continuous variable or coloring points by a discrete variable can be helpful to identify potential moderators of the treatment effect.
Arguments
- .model
a model produced by `bartCause::bartc()`
- descending
order the ICATEs by value?
- .order
a vector representing a custom order
- .color
a vector representing colors
- .alpha
transparency value [0, 1]
Examples
# \donttest{
data(lalonde)
confounders <- c('age', 'educ', 'black', 'hisp', 'married', 'nodegr')
model_results <- bartCause::bartc(
 response = lalonde[['re78']],
 treatment = lalonde[['treat']],
 confounders = as.matrix(lalonde[, confounders]),
 estimand = 'ate',
 commonSuprule = 'none'
)
#> fitting treatment model via method 'bart'
#> fitting response model via method 'bart'
plot_waterfall(model_results)

# }
# }